S.M.A.R.T Monitor
KillDisk supports displaying low-level disk specific S.M.A.R.T information.
To open the S.M.A.R.T monitor view, navigate the menu bar and select
S.M.A.R.T Information
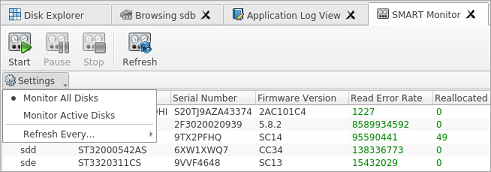
The S.M.A.R.T monitor displays a list of all discovered disks and shows S.M.A.R.T information in a grid. The following S.M.A.R.T information displayed in separate columns:
- Display Name
- Device Model
- Serial Number
- Firmware Version
- Read Error Rate
- Reallocated Sectors Count
- Spin-up Retries
- Command Timeout
- Reallocated Event Count
- Current Pending Sectors
- Reported Uncorrectable Errors
- Soft Read Error Rate
- Read Error Retry Rate
Configurable Settings
Parameters that can be configured in the drop-down Settings menu located on a toolbar:
- Monitored disks
- Here you have the option to either display All Disks seen by the system or only the Active Disks (being erased or examined).
- Refresh rate
- This specifies the interval in seconds between updates to the S.M.A.R.T. information displayed when the S.M.A.R.T. monitor is running.
S.M.A.R.T Monitor Start
The S.M.A.R.T monitor can either be refreshed manually or run continuously to keep the information current. To run the S.M.A.R.T monitor, click the Start button on the action toolbar. To pause or stop auto-refreshing sequence click Pause or Stop buttons in view's toolbar accordingly.
S.M.A.R.T monitoring is a process that requires a lot of resources. It can slow down Erase or Examine process significantly. We advise you to avoid querying S.M.A.R.T information often.